OTP Group: summary of the first quarter of 2024
published atMay 10, 2024Tags:results
OTP Group: summary of the first quarter of 2024
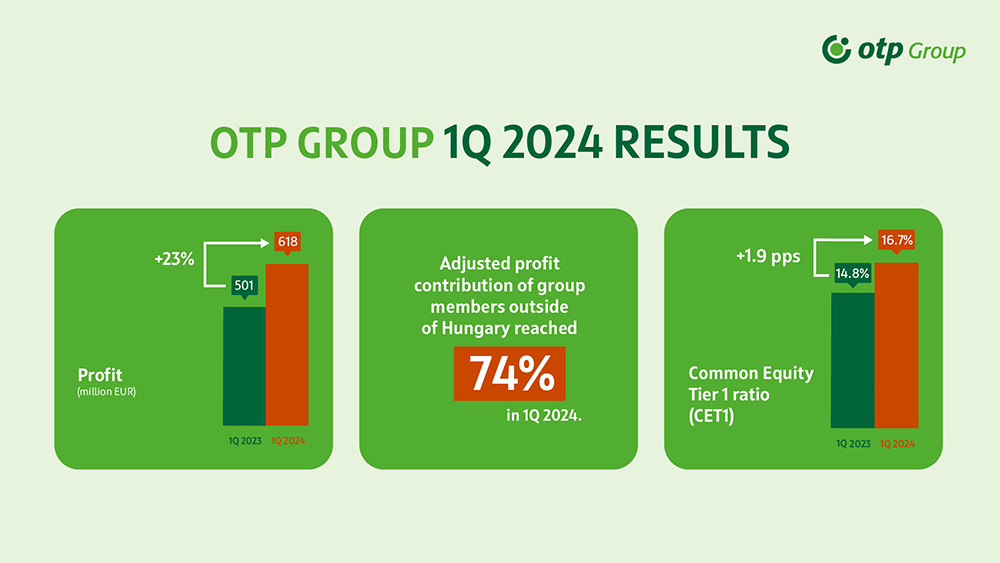
OTP Group posted EUR 615.3 million profit after tax in 1Q 2024, the ROE reached 22.7%1

The overall
performance of OTP Group was shaped mainly by the positive balance of total
risk costs (2023 4Q: -EUR 122 million, 2024 1Q: +EUR 17.7 million), to a lesser
extent by the marginal decline of the operating profit (-1% q-o-q). The y-o-y
comparison of the quarterly results was distorted by the fact that in 1Q 2023
NKBM, Slovenia had only a 2-month profit contribution.
Total income eroded by 4% q-o-q (+28% y-o-y). Within that the net interest income improved by 2% q-o-q and 40% y-o-y.
Other non-interest income decreased by 39% q-o-q (-23% y-o-y). Quarterly operating expenses moderated by 8% q-o-q from the seasonally high 4Q (+15% y-o-y), despite in a few countries annual regulatory charges were booked in 1Q and inflation put pressure on personal expenses. The consolidated cost-to-income ratio improved by 1.9% q-o-q to 44.1% (-4.7 pps y-o-y).
The 1Q amount of consolidated total risk costs comprised + EUR 17.7 million. Within that, the provisions for impairment on loan losses amounted to +EUR 23.1 million. Meaningful provisions were made in Uzbekistan, Russia and Romania, whereas there were substantial provision releases at OTP Core, Croatia and the Ukrainian subsidiary due to forward looking macroeconomic parameter revision under IFRS 9. In case of Ipoteka Bank, Uzbekistan risk cost dropped by two-thirds q-o-q.
As a result of all the above developments, in 1Q all Group members posted profits, foreign entities’ profit after tax contribution reached 74%.
The FX-adjusted consolidated performing (Stage 1+2) loan volumes increased by EUR 776.9 million or 1% q-o-q and exceeded EUR 57.18 billion. Above Group average volume growth was achieved in Bulgaria, Croatia, Montenegro (in each case +3% q-o-q) and Russia (+6% q-o-q), whereas in Uzbekistan and Ukraine performing loan volumes eroded by 2% and 1%, respectively.
As for the major segments, in 1Q the FX-adjusted performing consumer loan book grew by 4% q-o-q, the mortgage portfolio by 3%, respectively. The corporate loan book stagnated q-o-q, whereas the SME exposure dropped by 9% q-o-q. In Hungary the pace of mortgage loan extension in 1Q exceeded the consumer loan book’s dynamics. FX-adjusted deposits had a similar pace of growth: increased by 1% q-o-q and the total volume exceeded EUR 77.9 billion.
The consolidated net loan/(deposit+retail bond) ratio slightly increased q-o-q and reached 73%.
The quality of the consolidated credit portfolio remained stable with the major credit quality indicators shaping favourably.
The 1Q consolidated Common Equity Tier 1 (CET1) capital grew by EUR 530.8 million q-o-q including 1Q eligible earnings of EUR 538.5 million after dividend deduction. As a result of the comprehensive income the CET1 capital grew by EUR 302.6 million q-o-q, mainly due to currency rate changes (revaluation reserve increased by EUR 300 million).
If the Russian entity was deconsolidated and the outstanding gross intragroup exposures were written off as well, the effect for the consolidated CET1 ratio would be -5 bps, whereas in Ukraine the negative effect would be -11 bps.
As for the Management Guidance published on 8 March 2024, it is still effective, for the time being OTP’s management hasn’t seen reasons for modifying it.
For more information please click here.
1In line with the earlier hint from the management starting from 1Q 2024 an important methodology change has been made: only the effect of goodwill impairments and acquisitions will be taken out from the P&L hierarchy and shown at consolidated level as adjustment items. All other previous adjustment items will be booked at the particular geographies or business segments where they actually arise. In order to have comparable set of statistics, we present the numbers for 1Q and 4Q 2023 both under the old and new methodology. The balance sheet components, however, were not affected by these changes, we applied them only for the P&L items and financial indicators derived from them.